
مدیریت راهحلهای مبتنی بر طبیعت (NBS) در مناطق شهری برای کاهش کربن و پیامدهای تنوع زیستی یک چالش سیاست جهانی است، با این حال اطلاعات کمی در مورد چگونگی ارزیابی و ترکیب سیستمها و ارزشهای دانش متنوع در ارزیابیهای تبادل کربن-تنوع زیستی وجود دارد. این مقاله به بررسی روابط فضایی بین ارزشهای بیوفیزیکی و اجتماعی برای پتانسیل ترسیب کربن (اندازهگیری شده به عنوان دی اکسید کربن، CO2 ، شار) و تنوع زیستی در هلسینکی، فنلاند، با استفاده از ارزشگذاری یکپارچه میپردازد. این رویکرد روشهایی را از مدلسازی ترسیب کربن، رویکردهای امتیازدهی متخصص به ارزیابی تنوع زیستی و سیستمهای اطلاعات جغرافیایی مشارکت عمومی (PPGIS) ترکیب میکند. نتایج نشاندهنده ارتباط فضایی قوی بین ارزیابی بیوفیزیکی CO2 استاولویتهای شار و تنوع زیستی و ارتباط ضعیفتر بین ارزشهای بیوفیزیکی و اجتماعی. ادغام ارزشهای اجتماعی و بیوفیزیکی به مسیرهای متعددی برای حفاظت از NBS برای دستیابی به نتایج کاهش کربن و تنوع زیستی و همچنین گزینههایی برای هدفیابی فضایی برنامههای آموزشی و ظرفیتسازی در مناطق مورد توجه محلی منجر میشود.
معرفی
مدیریت مزایای مشترک راه حل های مبتنی بر طبیعت (NBS) در آب و هوا، تنوع زیستی و جامعه برای دستیابی به اهداف بی طرفی آب و هوا تعیین شده در توافقنامه پاریس 1 و اهداف احیای تنوع زیستی که در چارچوب تنوع زیستی جهانی کونمینگ -مونترال 2 مشخص شده است، از اهمیت حیاتی برخوردار است . مطالعات اخیر مستلزم تحقیق در مورد تأثیر متقابل بین تنوع زیستی، سازگاری با اقلیم و کاهش و همچنین نتایج عدالت زیست محیطی به منظور حفظ گرمایش جهانی در حد مطلوب 1.5 درجه سانتیگراد افزایش دمای جهانی، توقف از دست دادن تنوع زیستی جهانی و ارتقای رفاه انسان است . ، 4 .
با این حال، اغلب ارزیابیهای بیوفیزیکی تنوع زیستی و سازگاری با آب و هوا و اولویتهای کاهش در جدای از ارزیابیهای علوم اجتماعی در نظر گرفته میشوند. مدلهای بیوفیزیکی شواهد فزایندهای را نشان میدهند که درختان شهری 5 ، 6 ، 7 و پوشش گیاهی به طور گستردهتر 8 از جمله خاک زیرین نیز میتوانند سهم قابلتوجهی در کاهش انتشار گازهای گلخانهای (GHG) داشته باشند. مدلهای ارزیابی شار دیاکسید کربن (CO2 ) و پتانسیل ترسیب کربن NBS شهری در حال حاضر به خوبی تثبیت شدهاند . شار CO 2 تبادل CO 2 استمولکول های بین جو و سطح زیرین در هر سطح و زمان. مقادیر منفی نشان دهنده این است که سطح به عنوان سینک برای CO 2 عمل می کند و مقادیر مثبت نشان می دهد که به عنوان منبع عمل می کند.
Similarly, biophysical models demonstrate the biodiversity values of urban NBS, including urban forests and other types of urban green spaces11,12,13,14. One way of assessing biodiversity values is through scoring approaches which are simple to use and enable ranking of sites when the consideration of multiple criteria is important13,15, as is common in conservation planning16,17. Scoring approaches can be combined with expert elicitation to estimate the potential value for biodiversity18, integrating aspects of species richness, biomass, population density, evenness, and rarity at the whole city scale (following the approach of19). Models for assessing the trade-offs between biodiversity and carbon mitigation goals have also been developed, principally drawing on biophysical attributes20,21. Collectively, we consider modelled priorities for CO2 flux and biodiversity informed by scientific knowledge as ‘biophysical values.’
We are concerned that climate mitigation, adaptation and biodiversity assessments drawing on biophysical assessments alone will be challenging to implement unless they draw upon social factors22. One important social factor is social acceptability, which describes the extent to which a group of people prefer a given situation23. Considering social acceptability judgements alongside biophysical attributes can inform the feasibility24,25, uptake and success of management interventions26,27. It also can achieve greater geographic and socio-demographic representation28 necessary for procedural justice outcomes29,30.
Public participation geographic information systems (PPGIS) provides one way of eliciting social acceptability, operationalised in terms of landscape, place or social values31. Online PPGIS surveys generally involve random and/or convenience samples of residents or visitors identifying places of importance on a map of a given region using electronic points. In the analysis phase, values of each survey respondent are aggregated together to represent society, hence forming ‘social values’ or SV32. PPGIS and spatial conservation prioritization approaches have been combined to spatially identify synergies and trade-offs between SV and biophysical values for biodiversity, whereby SV for biodiversity are generated using PPGIS and biophysical values are generated using either scoring or complementary methods for assessing conservation priorities15,28,33,34,35. Socially acceptable and scientifically defensible priorities for conservation can be derived from the spatial overlays of high-high, and high-low value areas of social and biophysical value28,34, enabling the identification of specific geographic locations where conservation options are supported or opposed28.
Even though studies on CO2 sequestration and possibilities to increase sinks in various habitats have accumulated, the spatial relationships, as well as synergies and trade-offs, between social and biophysical values for biodiversity and CO2 flux have not been examined to date. Such integrated valuation can inform how to educate and involve residents in the protection of NBS for different outcomes, including managing them jointly for carbon sequestration and storage, biodiversity, and broader sustainability outcomes36. From a policy perspective, the results could be used to harmonise carbon neutrality and biodiversity conservation policies and actions in cities globally. For example, in Europe there is an urgent need to harmonise ambitions under the proposed EU Nature Restoration Law requiring no-net loss of biodiversity by 2030 and 5% gain in urban areas by 205037 with 2030 or 2035 (depending upon member state) carbon neutrality ambitions.
This paper aims to examine the spatial relationships between biophysical and SV for biodiversity and carbon sequestration potential (measured as CO2 flux) in the City of Helsinki, Finland. The approach combines methods from carbon sequestration modelling, expert scoring approaches to biodiversity assessment and PPGIS. We consider NBS with respect to the level of intervention38. While most NBS studies tend to focus on type 3 solutions of design and management of new ecosystems39, we focus on type 1 NBS: improving the protection of natural ecosystems like mature forests and protected wetlands/estuaries.
The aim will be addressed through three objectives: 1) to examine the spatial distribution of biophysical and SV for carbon mitigation and biodiversity conservation across different NBS in Helsinki; 2) to spatially examine the overlaps between biophysical and SV for carbon mitigation and biodiversity conservation, and; 3) to identify co-beneficial outcomes and trade-offs associated with the consideration of values for carbon mitigation and biodiversity conservation grounded in different knowledge systems. SV are linked to local knowledge systems and biophysical values are linked to scientific knowledge systems.
Helsinki, the capital of Finland, has a population of 660,000 within the municipal borders (the study area), and a population of 1.5 million in the metropolitan area40. According to the European Environmental Agency, the Helsinki metropolitan area is one of the greenest capital regions in Europe with NBS adding up to 62% of the total city area and urban trees cover 44% of the city area41 (Fig. 1a). The green structure is characterised by seven green wedges (or ‘fingers’) stretching from the hinterland to the city centre (Fig. 1b). The green wedges are foremost covered by urban forest and in the central part more open green spaces (parks), but also wetlands/estuaries, arable land and pastures.

a یک تصویر ساده از کاربری های شهری وسیع و انواع پوشش زمین و b با گوه های سبز مهم برای تجزیه و تحلیل های برجسته شده بر اساس اطلس شهری 2018 68 . موقعیت منطقه مورد مطالعه با توجه به فنلاند در ج نشان داده شده است .
شهر هلسینکی به طور فعال با NBS برای ترویج بی طرفی آب و هوا و حفاظت از تنوع زیستی همکاری می کند. NBS در برنامه اقدام تنوع زیستی شهر 42 برجسته شده است، و شهر در نظر دارد تا سال 2030 از کربن خنثی شود، عمدتاً با کاهش انتشار گازهای گلخانه ای، اما همچنین با بررسی پتانسیل های جذب کربن در طبیعت شهری 43 . با این حال، ستون فقرات ساختار سبز، گوه های سبز، تحت فشار فرآیندهای شهرنشینی، مانند تراکم 44 قرار دارند . و برخلاف بسیاری از شهرهای دیگر، شهر هلسینکی در طرح جامع خود بخشی از فضاهای سبز خود را برای توسعه اختصاص داده است، زیرا این شهر هم مرجع اصلی شهرسازی و هم مالک اصلی زمین است .. استراتژی جدید مدیریت جنگل هلسینکی با فشارهای متناقض حفاظت و توسعه دست و پنجه نرم می کند، به عنوان مثال، با افزایش تنوع برنامه ریزی شده در مناطق جنگلی، اجازه می دهد جنگل ها به طور طبیعی پیر شوند و جامعه محلی را در اقدامات مدیریتی جدید برای انطباق با تغییرات اقلیمی و تأثیرات آن درگیر می کند. شهر در حال رشد 46 . این شامل راه های جدیدی برای ادغام درک جامعه از تنوع زیستی و ترسیب کربن و ذخیره سازی در گزینه های مدیریت NBS است.
نتایج
نمایندگی نمونه
پاسخ دهندگان نظرسنجی بیشتر از آنچه که بر اساس جمعیت منطقه ای در هلسینکی انتظار می رود، زن، شاغل تر و کمی تحصیل کرده تر هستند. نسبت پاسخ دهندگان در رده های سنی جوان و پیر کمتر از جمعیت منطقه است. فاگرهولم و همکاران 47 در متاآنالیز PPGIS خود از پنج شهر مختلف در اسکاندیناوی، حضور بیش از حد زنان و انحرافات را در بین گروه های سنی و شغلی پیشینه گزارش کردند. رویکرد نمونهگیری بازنمایی فضایی را از تمام 34 ناحیه در هلسینکی تضمین کرد (شکل تکمیلی 1 را ببینید ). با این حال، ما در سه منطقه پرجمعیت کامپین مالمی، ملونکیلا و ووساری، نمونه برداری کمتری داشتیم.
ارزش های اجتماعی بر اساس محل سکونت و جمعیت شناسی اجتماعی
Residents mapped SV for biodiversity (3776.9 m) significantly closer to their domicile than SV for carbon sequestration and storage (4451.4 m, p < 0.001). Males mapped SV for biodiversity significantly further from their domicile (2702.0 m) compared with females (2393.0 m, p < 0.001). Younger respondents (<39 years) mapped SV further from their domicile than older respondents (>60 years), both for carbon and biodiversity (p < 0.001). Spatial discounting of values from domicile was less prominent for green wedges on the far eastern side of the city, relative to more central, or western green wedges for both SV for carbon (Kruskal-Wallis H = 330.4, df = 6, p < 0.001), and SV for biodiversity (Kruskal-Wallis H = 278.5, df = 6, p < 0.001). Median differences in value-domicile distances were found by age and education within some green wedges; however, the direction of these differences varied across green wedges.
We found proportional differences in SV by age, gender and income across green wedges (χ2 > 21.0, p < 0.05), but the direction of differences often change across them (Table 1). For example, younger residents assigned proportionately more SV for carbon to Central Park compared with senior residents (30.4 vs. 17.1%), but proportionately fewer SV for carbon (19.7 vs. 33.8%) and biodiversity (22.0 vs. 31.8%) to Western Park. While females assigned proportionately more SV than males to East Helsinki, Viikki-Kivikko and Western parks, this was not consistent for value types nor all wedges. Proportionately more values in the East-Helsinki culture park and Viikki-Kivikko green wedges were mapped by respondents with below- median salary, but the opposite was found in Östersundom and Central park green wedges. Senior respondents assigned proportionately more SV outside wedges compared with younger respondents.
Spatial distribution of CO2 flux and biodiversity values
We spatially assessed the top 20% of CO2 flux and biodiversity values, drawing on both biophysical and SV (Fig. 2, Table 2). Areas of overlap between all four value types include diverse urban habitat types. These include mature forests, protected wetlands/estuaries and recreational park areas, but also historically valuable military islands. Most of these enjoy some level of conservation or protection, indicating they are acknowledged in urban planning. The large island just south of Eastern Helsinki wedge is a military island and land cover data from there is limited, bringing large uncertainties in simulating biogenic CO2 fluxes.

Base layers for a CO2 flux (kg C m−2 year−1) where negative values indicate a carbon sink and positive values are sources, b Biodiversity, c SV for Carbon represented by the number of records, d SV for Biodiversity. Graduate colour schemes scaled by quantiles. Bivariate comparison between each layer can be found in Supplementary Fig. 2.
NBS acting as a CO2 source are concentrated on waste and unused land areas and agricultural fields (Fig. 2a). However, the majority of the study area is acting as a net biogenic sink (i.e. negative values). As expected, largest sinks were found in areas with high leaf mass for photosynthesis and sufficient water availability such as urban forests and large park areas. Also constructed green areas and street vegetation acted as a sink but were smaller due to their smaller leaf area. Areas of highest biodiversity values were found in the more remote green wedges, particularly Östersundom (75%) and Vuosaari Green Wedge (50%, Table 2). Nevertheless, areas of moderate biodiversity value were also found close to the urban core. The SV layers coincide with the green wedges, particularly those closer to more densely populated areas. Östersundom and the coastal islands were overlooked. These places may represent either very exclusive areas (western park due to expense, coastal areas due to lack of access) or areas of low population and associated access difficulties (Östersundom).
Top 20% of biophysical and SV for biodiversity and carbon
Biophysical values assessments (CO2 flux and biodiversity) spatially co-occur and the SV values (carbon and biodiversity) spatially co-occur. The biophysical values are more widespread. There is a notable difference between the SV and biophysical maps. High values of SV are concentrated in the wedges closer to the urban core while high CO2 flux and biodiversity values are concentrated in the wedges further from the urban core (Fig. 3). Greatest overlap between all 4 value types can be found in more heavily forested green wedges closer to the urban core or to existing residential areas. Not all overlapping areas are within the existing green wedges of Helsinki and therefore may be at greater risk of development. The correlation matrix of all variables and Spearman’s rank correlation coefficients show that all variables are significantly and positively correlated, pointing to a synergistic relationship between all values. SV for biodiversity and carbon were highly correlated (r = 0.59, p < 0.001), while SV and biophysical values were moderately to weakly correlated (r < 0.31, p < 0.001) (Supplementary Fig. 3).

Top 20% locations for a CO2 flux, b Biodiversity, c SV for Carbon, d SV for Biodiversity and e number of overlapping indicators from a–d. Graduate colour schemes scaled by quantiles. e Sum of all top 20% locations. f location of green wedges.
Overall, we found similar proportions of biophysical values for CO2 flux and biodiversity in each Green Wedge, with a few key exceptions. In total, 50% of Central Park was covered with the top 20% of CO2 values, while only 17% of the area was covered with the top 20% biodiversity values (Table 2). Similarly, 21% of Western Park was covered by the top 20% CO2 flux values, while only 4% of the park was covered by biodiversity values. In general, Western Park had the greatest area of no identified values (70%, Table 2). Differences in the spatial distribution of biophysical and SV were identified across the region (Table 2). Green wedges closer to the urban core had the greatest cover of both biophysical and SV, evidenced by Central Park (CO2 flux = 50%, SV Carbon = 22%; Biodiversity = 17%, SV Biodiversity = 20%) and Viikki and Kivikko (CO2 flux = 40%, SV Carbon = 18%; Biodiversity = 34%, SV Biodiversity = 27%). However, green wedges further from the urban core generally had higher cover of biophysical values for both biodiversity and carbon, and lower SV for each type. In other words, SV were concentrated in the central more urban green wedges and the biophysical values were more dispersed.
Management scenarios for nature-based solutions
ما توزیع فضایی را در اولویت ها برای سناریوهای مختلف مدیریت NBS در هلسینکی ارزیابی کردیم (شکل 4 ). سناریوی 1 – حداکثر کننده مقادیر بیوفیزیکی (شکل 4a) شامل مدیریت NBS برای 20 درصد از ارزشهای شار کربن و تنوع زیستی ارزیابیشده بیوفیزیکی است. این مناطق دارای بالاترین ارزش تنوع زیستی و دارای بالاترین پتانسیل ترسیب کربن هستند. بیشترین نسبت منطقه مورد مطالعه (9%) تحت این سناریو مدیریت می شود. مدیریت جنگلها برای تنوع زیستی و پیامدهای کربن در این سناریو عمدتاً در بخشهای شمال شرقی منطقه، از جمله Östersundom (58٪ گوه) و Vuosaari (34٪) گوههای سبز رخ میدهد. مناطق پارک هلسینکی (23٪) و پارک مرکزی (15٪) نیز برای کربن و تنوع زیستی مهم هستند. سناریوی 2 – ماکزیمایزر SV (شکل 4b) شامل مدیریت NBS برای 20 درصد بالای SV برای کربن و تنوع زیستی است. مدیریت تحت این سناریو عمدتاً به پارک ویکی-کیویککو (17٪) و پارک مرکزی (16٪) محدود می شود. در مجموع 70/2 درصد از منطقه مورد مطالعه مدیریت می شود. سناریوی 3 – بیشینه ساز کربن (شکل 4c ) شامل مدیریت مناطقی است که حاوی 20 درصد مقادیر بالای بیوفیزیکی برای شار CO 2 و SV برای کربن هستند. حوزههای اولویتدار برای مدیریت در این سناریو مشابه موارد مربوط به سناریو 2 است، با بالاترین امتیازات پارک ویکی-کیویککو (13%) و پارک مرکزی (21%). در مجموع 2.78 درصد از منطقه مورد مطالعه مدیریت می شود. سناریوی 4 – حداکثر کننده تنوع زیستی (شکل 4d) شامل مدیریت مناطقی است که دارای 20 درصد ارزش بیوفیزیکی برای تنوع زیستی و SV برای تنوع زیستی است. سایت های کمتری برای مدیریت در Viikki-Kivikko (10٪) و پارک مرکزی (7٪) در این سناریو در مقایسه با سناریوهای 2 و 3 یافت شد. در مجموع، 2.41٪ از منطقه مورد مطالعه مدیریت می شود. سناریوی 5 – همه 20٪ بالا (شکل 4e ) شامل مدیریت مناطق برای 20٪ بالای مقادیر برای همه لایه ها است. کمترین مقدار NBS تحت این سناریو مدیریت می شود (1.31٪ از کل منطقه مورد مطالعه).

چهار هم افزایی یک بیشینه ساز ارزش بیوفیزیکی (همپوشانی بین شار کربن و تنوع زیستی بالای 20 درصد)، ماکزیمایزر b SV (همپوشانی بین 20 درصد SV کربن و تنوع زیستی SV)، حداکثر کننده کربن c (همپوشانی بین 20 درصد کربن بالا و کربن SV)، d حداکثرکننده تنوع زیستی (همپوشانی بین 20 درصد تنوع زیستی برتر و تنوع زیستی SV، بیوفیزیکال کربن و تنوع زیستی و متعادل کننده SV (همپوشانی مقادیر بالای 20 درصد).
بحث
In this study, we presented a new integrated valuation method for spatially comparing priorities for NBS management for carbon mitigation and biodiversity conservation, drawing on biophysically assessed and social value perspectives. We highlight the critical importance of protecting existing NBS for biodiversity and carbon mitigation outcomes based on biophysical assessments, while also taking account of SV to increase the social acceptability of NBS management and implementation efforts.
We demonstrated how ecological, carbon flux and social acceptability criteria can be applied to identify opportunities for biodiversity conservation and carbon mitigation. The strong alignment between biodiversity and carbon sink areas points to the importance of protecting existing vegetated, especially forested, landscapes for biodiversity and carbon mitigation outcomes. The City of Helsinki has a biologically rich landscape comprising of mainly forests, but also wetlands and open rocks, and semi-natural areas including meadows and pastures48. Much of the academic scholarship at present is on the tensions between biodiversity and carbon mitigation outcomes in the design and implementation of NBS49,50; however, these findings remind us that protecting and restoring existing NBS in urban areas is vital for achieving both carbon mitigation and biodiversity goals.
Building on earlier work15,28,34, the results highlight that residents can provide important and valid spatial information for biodiversity conservation particularly in areas closer to the city core which are more accessible to a higher number of residents. We extend previous research by showing that there is potential for synergies between biodiversity and SV in protected areas and nature sites35. However, integration of SV for biodiversity and carbon can also lead to sub-optimal conservation and carbon mitigation outcomes, as demonstrated by the large spatial disconnects in biophysical and SV in green wedges located further away from the urban core. Such disconnections highlight the need for some caution in the application of social data to conservation and carbon mitigation assessments51, for example, balancing human access to healthy habitats and the creation of opportunities for non-human species to flourish52. Biodiversity and carbon sequestration concepts are challenging concepts to understand, and we did not expect that biophysical and social values would spatially align in all places. We contend that the results provide pathways for raising awareness and building capacity for joint biodiversity conservation and carbon mitigation actions, while also spotlighting areas that are both scientifically defensible and socially acceptable for climate mitigation, adaptation and biodiversity conservation.
It remains unclear as to whether residents are assigning values for biodiversity and carbon based on accessibility criteria (akin to experiential knowledge) or based on deeper cognitive understanding of biodiversity and carbon mitigation concepts. The strong spatial correlation between SV for biodiversity and carbon sequestration suggests that respondents assigned these values to similar areas. The fact that males and younger respondents are assigning their values further from domicile than female and older respondents suggest that accessibility and experience indicators are influencing value attribution to both carbon mitigation and biodiversity conservation. The variation in SVs by green wedge type and socio-demographics support earlier assessments showing that SV (in that case perceived biodiversity and recreation) in Helsinki were significantly affected by geographic area, gender and income53.
Value assignment could also be influenced by the convenience sampling approach. Most value dots were assigned to districts within the urban core that are also highly populated (Supporting Fig. 1). An under-sampling occurred in three highly populated districts of Kampinmalmi, Mellunkylä, Vuosaari, resulting in proportionately fewer mapped points in those areas.
Yet green wedge type and socio-demographics cannot consistently explain differences in the spatial distribution of SV. Irrespective of the basis for value, the results demonstrate that NBS protection measures, for carbon mitigation, biodiversity conservation or both, should be combined with public acceptance of measures of carbon sequestration and storage, including the types of plantings and the nature of dead matter to be retained in a given green space. In locations where SV for carbon or biodiversity align with biophysical values, the social acceptability measures can be used to prioritise carbon mitigation, adaptation and biodiversity conservation efforts. Equally, areas of low carbon and low biodiversity priorities based on biophysical assessment and SV assessments could be discounted in the planning process.
Our integrated assessment also provides vital information about how to design capacity building and awareness raising opportunities, particular in areas of spatial disconnect between SV and biophysical priorities (Table 3). For example, areas of high carbon and high biodiversity but low social values for both attributes could be focal areas for education about why carbon sequestration is important in these areas, and what species or ecosystems contribute to the biodiversity values found there.
Caveats
The green wedges as planning tools capture the “most important areas”, but there are large areas of moderate biodiversity value not covered by them. One needs to also take these outlying areas into planning and into future regional assessments of the spatial overlaps between biophysical and SV of biodiversity and carbon sequestration potential. The research focuses on the management of existing NBS for carbon sequestration and biodiversity conservation, but does not directly inform biodiversity restoration efforts. Also, the research focuses on priority areas for management. The type of management that would best foster both biophysical and SV may depend on what kind of ecosystems these areas include in addition to community preferences for engagement and just outcomes.
Integrated valuation necessarily involves combining values that have different metrics. Indeed, there are operational differences in how we assessed ‘value’ across biophysical and SV perspectives. For example, in the carbon models we assessed carbon flux in terms of whether a given site is a source or sink for carbon on annual basis, without considering emissions related to planting or maintenance of urban trees as their full lifecycle was not assessed, while in the SV for carbon we asked individuals to identify areas that are highly important for carbon sequestration AND storage. Future research could refine the operational measures across knowledge systems to aid more direct comparisons also including the emissions arising from the seedling production, transport and maintenance of urban trees and their growing media.
The bias towards female and employed respondents is an important limitation of this study, but confirms previous work showing that issues of gender53 and socio-economic vulnerability54 influences the assignment of SV. Women also respond more often to studies on green areas in the Nordic region47. While socio-demographic factors can influence the number of points assigned to a map, socio-demographic biases wrought by different sampling techniques (e.g., convenience vs. representative), have been found to have little influence on location accuracy of SV55. It was difficult to test this hypothesis in the current paper given that most data were collated through a convenience sample. Future research could engage more diverse, including marginalised groups, in the assessment of social acceptability to better understand ‘whose values’ rather than what values and where are likely to be affected by different biodiversity conservation and climate mitigation and adaptation strategies. This approach reflects current calls for just processes in urban green transitions for climate neutrality and biodiversity enhancement56.
Methods
Socio-demographic and spatial discounting analyses
تجزیه و تحلیل مجذور کای (آزمون استقلال) با باقیمانده های استاندارد شده برای شناسایی تفاوت های متناسب بین متغیرهای اجتماعی-دموگرافیک (سن، جنسیت، اشتغال، تحصیلات، درآمد) و SV نقشه برداری شده برای کل منطقه و درون گوه های سبز هلسینکی انجام شد. باقیمانده تفاوت در فرکانس مشاهده شده و فرکانس مورد انتظار است (یعنی مقداری که در فرضیه صفر عدم ارتباط انتظار می رود). با تقسیم مقدار باقیمانده بر خطای استاندارد باقیمانده محاسبه می شود. باقیمانده نشان دهنده امتیاز نرمال شده است. اگر بیشتر از 2.0 باشد، آنها نشان میدهند که تعداد قابل توجهی از افراد نسبت به آنچه انتظار میرود، یک نوع ارزش اجتماعی معین را ترسیم کردهاند. ما همچنین اطلاعات جمعیتی-اجتماعی همه پاسخ دهندگان به نظرسنجی را با داده های سرشماری شهرداری مقایسه کردیم 57 .
برای بررسی رتبههای میانه برای فاصله نقشهبرداری شده از محل اقامت تا مکانهای سبز مهم نقشهبرداری شده، آزمایشهای فاصله اقلیدسی را در ArcGIS انجام دادیم. هنگامی که فاصله های میانه در بین متغیرهای اجتماعی-دموگرافیک با استفاده از ANOVA (آزمون کروسکال-والیس) در رابطه با (1) SV برای تنوع زیستی و (2) SV برای کربن مقایسه شد.
مدلسازی شار CO 2
تنوع فضایی شار CO2 در هلسینکی در سال 2020 با تقسیم مساحت زمین شهر به شبکههای 250×250 متر شبیهسازی شد. ما از این قطعنامه استفاده کردیم زیرا با سیستم طبقه بندی شهری- روستایی در فنلاند مطابقت دارد و بنابراین نتایج ما از تلاش های برنامه ریزی گسترده تر پشتیبانی می کند. مدل مورد استفاده در محاسبات، طرح تعادل آب و انرژی شهری سطحی SUEWS 58 ، 59 بود که اخیراً برای شبیهسازی شارهای سطحی CO2 انسانی و زیستزا بهروزرسانی شده است .. برای هر شبکه، اطلاعات سطح شامل کسری از پوششهای سطحی مختلف (ساختمانها، سطوح سنگفرش، خاک پایه، درختان/بوتهها و چمنزار)، ارتفاع درخت و ساختمان، با ترکیب مجموعه دادههای اسکن شده در هوابرد با نقشههای کاربری زمین در سطح شهر بهدست آمد . پوشش گیاهی در هر شبکه بر اساس پایگاه داده درخت شهری شهر هلسینکی به سه طبقه، جنگل شهری، پارک ها و درختان خیابان تقسیم شد. در هر شبکه، کلاس پوشش گیاهی غالب استفاده شد که با مساحت جنگلهای شهری و تعداد درختان خیابان یا پارک تعریف میشد. هر کلاس پارامترهای هدایت سطحی خود را بر اساس CO2 داردمشاهدات شار انجام شده در اکوسیستم های مختلف. پارامترهای جنگل شهری از اندازهگیریهای کوواریانس گردابی سطح اکوسیستم انجام شده در جنگل پهن برگ در هاروارد، ایالات متحده 61 ، پارامترهای درخت خیابان از اندازهگیریهای تبادل گاز سطح برگ ساختهشده از درختان خیابان در هلسینکی 62 و اندازهگیریهای تبادل گاز مناطق پارک از مشاهدات تبادل گاز انجام شده در به دست آمد. پارکی در هلسینکی 63 .
SUEWS توسط داده های ساعتی برای سال 2020 اجباری شد. مجموعه داده اجباری هواشناسی شامل دمای هوا، بارش، تابش موج کوتاه و بلند، رطوبت نسبی، فشار هوا و سرعت باد بود. منبع اصلی داده ایستگاه رصد هواشناسی کومپولا (60.20307N؛ 24.96131E) بود که توسط موسسه هواشناسی فنلاند اداره می شد. دادهها با مشاهدات ایستگاه اندازهگیری شهری SMEAR III که در Kumpula 62 واقع شده بود، پر شد . هر شکاف داده ای باقیمانده با داده های ساعتی ERA5 Land 64 پر شد .
مدل سازی ارزش های تنوع زیستی
برای تنوع زیستی، از مجموعه داده های Jalkanen و همکاران استفاده کردیم. 13 که به صورت باز توزیع می شوند (به بخش در دسترس بودن داده ها مراجعه کنید). در این مطالعه، کارشناسان طبقه بندی محلی، انواع زیستگاه های شهری را از نظر ارتباط آنها با تنوع زیستی شهری در هلسینکی امتیاز دادند. ارزیابی ارزش های تنوع زیستی بر اساس چارچوب کیفیت تنوع زیستی 18 ساخته شده استو شامل هفت معیار است که به طور مشترک مجموعه گونه ها را در یک مکان مشخص توصیف می کند و می تواند برای امتیازدهی مناطق مختلف از نظر اهمیت آنها برای تنوع زیستی استفاده شود. معیارها عبارتند از: غنای گونه ای، زیست توده کل، فراوانی، یکنواختی (آیا برخی از گونه های منفرد بر جوامع تسلط دارند یا اینکه افراد به طور مساوی در بین گونه ها توزیع شده اند)، منحصر به فرد بودن (آیا مجموعه گونه ها به گونه ای هستند که در سایر انواع زیستگاه های شهری یافت نمی شوند)، زیستگاه گونه های تخصصی، و نمایندگی منطقه ای (نوع زیستگاه شهری در مقایسه با زیستگاه های مشابه موجود در مناطق روستایی مجاور چقدر نماینده یا “طبیعی” هستند).
In 2016, 24 local taxonomic experts scored 68 terrestrial urban habitat types in terms of their general support for the Biodiversity Quality attributes of their taxon. Evaluated habitats ranged from seminatural habitats (e.g. old-growth forests, shoreline meadows) to anthropogenic environments (e.g. private gardens, golf courses, managed parks). The elicitation covered ten taxa: vascular plants, polypores, fungi (excluding polypores), herpetofauna (reptiles & amphibians), birds, bats, mammals (excluding bats), butterflies, hymenoptera, and beetles. Elicitation was done by 2–3 experts per taxon. The experts scored each habitat type in terms of how well they support each of the 7 Biodiversity Quality attributes of their taxon (scale of 0–4). In addition, experts assessed the confidence of their answers separately for each Biodiversity Quality attribute. Taxon- and attribute-specific score was calculated as the mean of respective expert answers, weighted by answers’ self-assessed confidence. In other words, ‘bird richness score for golf courses’ was calculated as the average of all bird experts’ confidence-weighted scores for golf courses. To emphasise confident answers, the confidence coefficient could be 0, 1, 2, 4, or 8, corresponding to “very unconfident”, “unconfident”, “somewhat unconfident”, “somewhat confident”, and “very confident” answers, respectively. See Jalkanen et al. 13,19 and survey (https://zenodo.org/record/1255899) for exact questions and habitat descriptions given for the experts, and the expert answers.
امتیاز ترکیبی یک تاکسون برای هر نوع زیستگاه به عنوان مجموع وزنی تمام ویژگی های کیفیت تنوع زیستی ارزیابی شده برای تاکسون محاسبه شد (شکل 5 ). وزن ها توسط کارشناسان در یک کارگاه بر اساس ارتباط این ویژگی برای ماندگاری و عملکرد تولید شده توسط مجموعه گونه های شهری محلی تعریف شد. در نهایت، امتیاز تنوع زیستی کل یک نوع زیستگاه به عنوان میانگین وزنی تمام نمرات تاکسون خاص محاسبه شد. براساس ارتباط کلی تاکسون برای عملکرد و تداوم اکوسیستمهای شهری، کارشناسان به طور مشترک در یک کارگاه وزنگذاری شدهاند. به عنوان مثال، گیاهان (40٪ از امتیازات وزنی) برای اکوسیستم های شهری بسیار مهم تر از خفاش ها (1٪) دیده می شوند 13 (به مواد حمایتی 3 مراجعه کنید.برای وزنه ها).
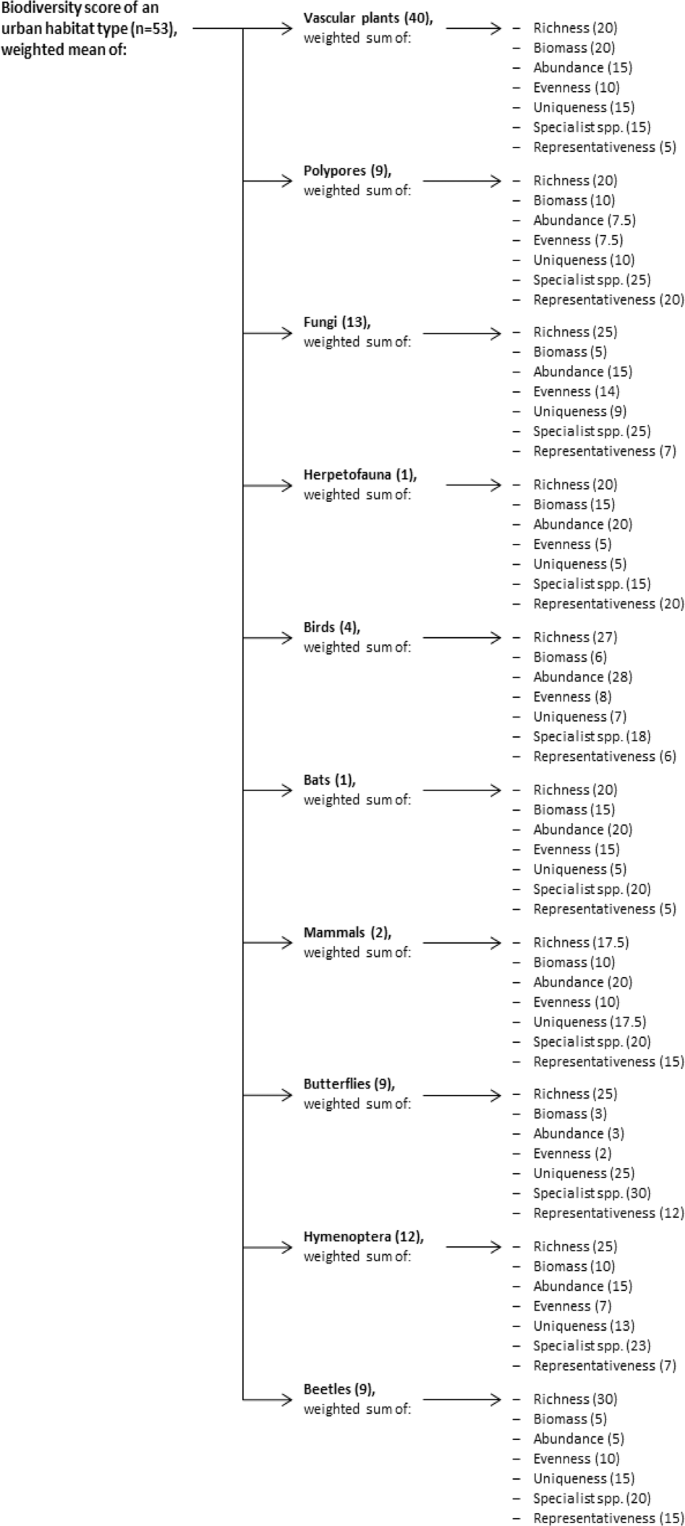
امتیازات برای انواع مختلف زیستگاه شهری به عنوان میانگین وزنی امتیازات برای گونههای مختلف محاسبه شد، که خود بهعنوان مجموع وزنی امتیازات متخصص در رابطه با ویژگیهای کیفیت تنوع زیستی محاسبه شد. وزن ها در داخل پرانتز نشان داده شده است. هم وزنهای بین طبقهبندی و هم وزنهای ویژگی در هر نمره تاکسون به 100 اضافه میشوند.
لایه تنوع زیستی فضایی بر اساس نقشه زیستگاه شهری است که برای هلسینکی از چندین منبع GIS تهیه شده است. این نقشه شامل 53 نوع زیستگاه شهری بود (هیچ داده مکانی برای همه انواع زیستگاه های کوچک در دسترس نبود) و تمام زمین های عمومی و خصوصی را پوشش می داد. وضوح نقشه از نوع شطرنجی 20×20 متر بود. هر کلاس نوع زیستگاه پس از آن به امتیاز تنوع زیستی مربوطه (یعنی امتیاز ترکیبی از همه گونهها و ویژگیهای کیفیت تنوع زیستی) طبقهبندی شد. امتیازها از 1283.3 (حیاط بلوک آپارتمان مهر و موم شده) تا 10772.8 (بیلستان های قدیمی) متغیر بود. سطوح سنگفرش شده (جاده ها، ساختمان ها، و غیره) به عنوان 0 و بدنه های آبی به عنوان داده های گمشده در نظر گرفته شدند 13 .
مدل سازی ارزش های اجتماعی برای کربن و تنوع زیستی
دادههای SV برای تنوع زیستی و کربن با استفاده از یک نظرسنجی آنلاین سیستم اطلاعات جغرافیایی مشارکت عمومی (PPGIS) که در بین ساکنان هلسینکی از سپتامبر تا نوامبر 2021 توزیع شده است (روشهای تکمیلی) جمعآوری شد. نمونه با استفاده از روش ترکیبی 65 تولید شد . ابتدا، ما پیوند نظرسنجی را بهطور تصادفی بین 1000 خانوار در هلسینکی از طریق یک دعوت نامه پستی با یادآوریهای بعدی پس از 15 روز توزیع کردیم. علاوه بر این، این نظرسنجی در رسانه های اجتماعی (به عنوان مثال گروه های فیس بوک از انجمن های ساکنان محلی)، روزنامه های آنلاین و سایر پوشش های رسانه ای تبلیغ شد.
در مجموع 3237 نفر به این نظرسنجی پاسخ دادند که از این تعداد 1208 نفر اکثر سوالات را تکمیل کردند. شرکت کنندگان در مجموع از 23187 مکان نقطه در مکان های زمینی در منطقه مورد مطالعه نقشه برداری کردند که نشان دهنده فضاهای سبز با تنوع زیستی بالا ( n = 3633)، ارزش های طبیعی ( n = 3497) و کربن بالا ( n = 3787) است. شرکتکنندگان میتوانند هر تعداد یا چند نقطه را که میخواهند به منطقه هلسینکی اختصاص دهند. پاسخهای این نظرسنجی عمدتاً از تعامل با رسانههای اجتماعی بهدست آمد که 80.75 درصد از نمونهای را که از آن اطلاعات توزیع داشتیم ( n) را تشکیل میداد. = 857). علاوه بر این، 5.48 درصد از پاسخ ها توسط دوستان و همکارانی که نظرسنجی را در شبکه اجتماعی خود به اشتراک گذاشته بودند، به دست آمده است. دعوت نامه های پستی منجر به نرخ پاسخ نظرسنجی فقط 3.30٪ (33 پاسخ از 1000 دعوت تصادفی) شد. انجمن های محلی، روزنامه ها و سایر کانال های توزیع به ترتیب 3.15، 1.63 و 3.85 درصد از نمونه را تشکیل می دادند.
زنان بیشتری ( N = 2308؛ 71.3٪) نسبت به مردها ( n = 725؛ 22.4٪) در نظرسنجی شرکت کردند، که نشان دهنده حضور بیش از حد زنان در پاسخ های نظرسنجی بود (در مقایسه با 52.48٪ زن در منطقه هلسینکی). بیش از نیمی از پاسخ دهندگان نظرسنجی ما (54.2%) بین 35 تا 65 سال سن داشتند، با پاسخ دهندگان جوان (<35 سال) و مسن تر (بیش از 65 سال) در مقایسه با جمعیت هلسینکی (16.2٪ نمونه در مقابل 34.8) کمتر حضور داشتند. ٪ منطقه <35 سال؛ 12.8٪ نمونه در مقابل 20.1٪ منطقه > 65 سال). علاوه بر این، تعداد پاسخ دهندگان دارای حداقل تحصیلات متوسطه بالاتر (98.9%) نسبت به جمعیت هلسینکی (76.8%) بود .. نرخ بیکاری برای همه گروههای سنی برای پاسخدهندگان ما در مقایسه با جمعیت هلسینکی پایینتر بود (همانجا)، به احتمال زیاد میانگین درآمد سالانه بالاتر پاسخدهندگان نظرسنجی ما (40573 €) را در مقایسه با ساکنان هلسینکی (38736 €) توضیح میدهد . . این نتایج نشان دهنده یک سوگیری جزئی به پاسخ دهندگان میانسال، تحصیلکرده و شاغل با درآمد بالاتر در نظرسنجی هلسینکی در مقایسه با آمار سرشماری منطقه ای هلسینکی است.
این مقاله بر اساس سه سوال نقشه برداری و بر اساس پیشینه اجتماعی و جمعیت شناختی پاسخ دهندگان است. پرسشهای فضایی از پاسخدهندگان خواسته شد تا نقشهبرداری کنند: 1) فضاهای سبز مورد علاقه خود در هلسینکی و دلایل اهمیت آنها (بر اساس یک منوی کشویی). 2) فضاهای سبز به عنوان ارزش بالا برای ترسیب و ذخیره کربن در هلسینکی، و. 3) فضاهای سبز به عنوان ارزش بالایی برای تنوع زیستی در هلسینکی درک شده است. پاسخ دهندگان این فرصت را داشتند که متن کوتاهی را که در مورد برداشت های خود در دو سوال آخر نقشه برداری توضیح می داد اضافه کنند.
برای استخراج تنوع زیستی SV، از شرکت کنندگان در نظرسنجی خواسته شد تا مکان هایی را که آنها تنوع زیستی بالایی در فضاهای سبز شهری هلسینکی می دانند، نقشه برداری کنند. برای استخراج کربن SV، از نقاطی که مکانهای مهم برای ترسیب یا ذخیرهسازی کربن را نشان میدهند، استفاده شد. از شرکتکنندگان در نظرسنجی خواسته شد تا مکانهایی را که ترسیب و ذخیرهسازی کربن را در فضای سبز شهری هلسینکی بالاتر میدانند، نقشهبرداری کنند. سپس با استفاده از یک سلول شبکه 250 متری، نقاط PPGIS نگاشت شده فوق در هر سلول شبکه شمارش شد. از این، یک لایه شبکه نشان دهنده تعداد نقاط برای SV کربن و تنوع زیستی تولید شد.
تجزیه و تحلیل پوشش فضایی
ما تحلیلهای همپوشانی فضایی را برای ارزیابی روابط فضایی بین بیوفیزیکی و SV برای کربن و تنوع زیستی انجام دادیم. همه مجموعه داده ها ابتدا با استفاده از یک شبکه مشترک 250 متری پیش پردازش شدند که نشان دهنده درشت ترین مجموعه داده فضایی با وضوح (شار CO2 ) و همچنین مقیاس فضایی مربوط به برنامه ریزان شهری است. علاوه بر این، انتخاب رزولوشن 250 متری عدم قطعیت مرتبط با چالش نقشه برداری دقیق فضاهای سبز کوچک و خطی را برطرف می کند .
برای پرداختن به مشکلات مرتبط با ترکیب، مقایسه و تجزیه و تحلیل دادههای به دست آمده از طریق روشهای تحلیلی کاملاً متفاوت (به عنوان مثال، دادههای اجتماعی در مقابل دادههای بیوفیزیکی مدلسازیشده، مقیاسهای اندازهگیری، مقادیر حداکثر و حداقل، و انتزاع فضایی) هر لایه بر اساس مقادیر رتبهبندیشدهشان ترکیب شد. استفاده از مقادیر رتبهبندی شده اهمیت ویژهای داشت زیرا هر مجموعه داده دارای مقادیر بسیار متفاوت و غیرعادی توزیع شده بود، که مقایسه با استفاده از مقادیر مطلق را از نظر مفهومی دشوار میکرد. استفاده از مقادیر رتبهبندیشده و شناسایی ارزشهای با رتبه بالا بهعنوان پروکسی برای منطقه حفاظتی اولویتدار در اولویتبندی حفاظت فضایی مانند استفاده از نرمافزار برنامهریزی حفاظت مانند Zonation 67 رایج است .
در مرحله اول، پنجکها، بهویژه 20 درصد بالای شار CO2، ارزشهای تنوع زیستی و بیوفیزیکی و SV را ترسیم کردیم . این مقادیر بالای 20 درصد برای نشان دادن مناطق اولویت دار برای کاربرد NBS در سیاست های محلی استفاده شد. ما 20 درصد برتر را بر اساس تجزیه و تحلیل حساسیت مقادیر 20 درصد در مقابل 30 درصد انتخاب کردیم (جدول تکمیلی 1 ). در حالی که مساحت کل نقاط داغ در تجزیه و تحلیل 30 درصد بالا افزایش یافته است، الگوهای گسترده مقادیر بالا و پایین در سراسر پارک ها و درون پارک ها تمایل به حفظ دارند. در مرحله بعد، ما تمام مقادیر بالای 20% را برای ارزیابی رابطه فضایی بین مقادیر بالای 20% جمع آوری کردیم. در نهایت، ما سطح همپوشانی را با استفاده از ترکیبات مختلف 20٪ پیکسل بالای CO2 ارزیابی کردیمشار، تنوع زیستی و SV برای کربن و تنوع زیستی، برای پنج سناریو مختلف: 1. بیشینه ساز مقادیر بیوفیزیکی، 2. بیشینه ساز SV، 3. بیشینه ساز کربن، 4. تنوع زیستی و 5: کربن و تنوع زیستی بیوفیزیکی و متعادل کننده SV (جدول 4 ) . ما این سناریوها را برای کل منطقه مورد مطالعه و همچنین در هفت گوه سبز مشخص کردیم.
استفاده از یک آستانه برای مقادیر رتبه بندی شده بر اساس تعدادی از معیارها معمولاً در ادبیات برنامه ریزی حفاظت فضایی استفاده می شود . ما 20٪ را انتخاب کردیم زیرا این آستانه معقول برای تعیین زیرمجموعه ای از منطقه مورد مطالعه است که نشان دهنده کانون های اولویت است. با این حال، ما مقادیر بالای 33٪ (یعنی یک سوم مقادیر) را برای آزمایش حساسیت الگوهای فضایی به انتخاب مقدار آستانه محاسبه کردیم (برای اطلاعات بیشتر به شکل تکمیلی 3 مراجعه کنید ) .
در دسترس بودن داده ها
تمام داده های غیر مکانی تولید یا تجزیه و تحلیل شده در طول این مطالعه از وب سایت های زیر موجود است. ارزش های تنوع زیستی بر اساس یک مجموعه داده باز توسط Jalkanen & Vierikko 2022 ( https://doi.org/10.5281/zenodo.6563190 ) ایجاد شد که شامل نقشه ای از انواع زیستگاه های شهری در هلسینکی و نتایج استخراج توسط کارشناسان طبقه بندی محلی است. . برای لیست کامل انواع زیستگاه های شهری و توضیحات آنها و سوالات دقیق ارائه شده برای کارشناسان، مجموعه داده را مشاهده کنید. شار CO 2 برای هلسینکی به دست آمده از اجرای مدل SUEWS در مجموعه داده باز توسط Havu و همکاران، 2022 در دسترس است ( https://doi.org/10.5281/zenodo.7198140). در دسترس بودن داده ها مشروط به دسترسی کنترل شده: حفظ حریم خصوصی و مسائل اخلاقی ما را از به اشتراک گذاشتن داده های رکورد واحد در SV برای کربن و تنوع زیستی باز می دارد. درخواست های دسترسی را می توان به آدرس christopher.raymond@helsinki.fi ارسال کرد.
منابع
-
UNFCCC. تصویب موافقتنامه پاریس، بیست و یکمین کنفرانس طرفین . https://unfccc.int/process-and-meetings/the-paris-agreement/the-paris-agreement (2016).
-
CBD. چارچوب جهانی تنوع زیستی کونمینگ-مونترال . https://www.cbd.int/conferences/2021-2022/cop-15/documents (2022).
-
پاسکوال، یو و همکاران. حاکمیت برای تغییر دگرگونی در سراسر پیوند تنوع زیستی-اقلیم-جامعه. Bioscience 72 ، 684-704 (2022).
-
Seddon, N. استفاده از پتانسیل راه حل های مبتنی بر طبیعت برای کاهش و سازگاری با تغییرات آب و هوا. Science 376 ، 1410-1416 (2022).
-
Davies، ZG، Edmondson، JL، Heinemeyer، A.، Leake، JR & Gaston، KJ نقشهبرداری یک سرویس اکوسیستم شهری: کمی کردن ذخیرهسازی کربن در سطح زمین در مقیاس سطح شهر. J. Appl. Ecol. 48 ، 1125-1134 (2011).
-
De la Sota، C.، Ruffato-Ferreira، VJ، Ruiz-García، L. & Alvarez، S. زیرساخت سبز شهری به عنوان یک استراتژی برای کاهش تغییرات آب و هوایی. مطالعه موردی در شمال اسپانیا. شهری برای. Urban Green 40 , 145–151 (2019).
-
Nowak، DJ، Greenfield، EJ، Hoehn، RE & Lapoint، E. ذخیره و جداسازی کربن توسط درختان در مناطق شهری و اجتماعی ایالات متحده. محیط زیست آلودگی 178 ، 229-236 (2013).
-
Vaccari، FP، Gioli، B.، Toscano، P. & Perrone، C. ارزیابی تعادل دی اکسید کربن شهر فلورانس (ایتالیا)، و مفاهیم برای برنامه ریزی شهری. Landsc. طرح شهری. 120 ، 138-146 (2013).
-
هاردیمن، BS و همکاران. محاسبه شارهای بیوژنیک شهری در بودجه های کربن منطقه ای علمی کل محیط. 592 ، 366-372 (2017).
-
Järvi، L. و همکاران. مدل سازی فضایی انتشارات دی اکسید کربن زیست زا و انسانی در مقیاس محلی در هلسینکی. جی. ژئوفیس. Res. اتمس. 124 ، 8363-8384 (2019).
-
گوردون، آ.، سیموندسون، دی، وایت، ام.، مولانن، آ و بکسی، SA ادغام برنامه ریزی حفاظت و برنامه ریزی کاربری زمین در مناظر شهری. Landsc. طرح شهری. 91 ، 183-194 (2009).
-
Hermoso, V., Salgado-Rojas, J., Lanzas, M. & Álvarez-Miranda, E. اولویت بندی فضایی مدیریت برای حفاظت از تنوع زیستی در سراسر اتحادیه اروپا. Biol. حفظ کنید. 272 ، 109638 (2022).
-
Jalkanen, J., Vierikko, K. & Moilanen, A. اولویت بندی فضایی برای کیفیت تنوع زیستی شهری با استفاده از نقشه های بیوتوپ و نظر کارشناسان. شهری برای. سبز شهری. 49 , 126586 (2020).
-
Pickett، STA، Cadenasso، ML، Childers، DL، Mcdonnell، MJ & Zhou، W. تکامل و آینده علوم اکولوژیکی شهری: اکولوژی در، از، و برای شهر. اکوسیستم. شفا دادن. حفظ کنید. 2 , e01229 (2016).
-
Bryan، BA، Raymond، CM، Crossman، ND & King، D. مقایسه ارزشهای اکولوژیکی و اجتماعی صریح فضایی برای مناطق طبیعی برای شناسایی استراتژیهای حفاظتی مؤثر. حفظ کنید. Biol. 25 ، 172-181 (2011).
-
Regan, HM, Davis, FW, Andelman, SJ, Widyanata, A. & Freese, M. معیارهای جامع ارزیابی تنوع زیستی در برنامه ریزی حفاظت. تنوع زیستی حفظ کنید. 16 ، 2715-2728 (2007).
-
سرکار، اس و همکاران. ابزارهای برنامه ریزی حفاظت از تنوع زیستی: وضعیت فعلی و چالش های آینده. آنو. کشیش محیط زیست. منابع 31 ، 123-159 (2006).
-
Feest, A., Aldred, TD & Jedamzik, K. کیفیت تنوع زیستی: پارادایم برای تنوع زیستی. Ecol. اندیک. 10 ، 1077-1082 (2010).
-
Jalkanen, J., Toivonen, T. & Moilanen, A. شناسایی شبکه های اکولوژیکی برای برنامه ریزی کاربری اراضی با اولویت بندی حفاظت فضایی. Landsc. Ecol. 35 ، 353-371 (2020).
-
Newton، PA، Oldekop، J.، Brodnig، G.، Karna، BK & Agrawal، A. کربن، تنوع زیستی، و معیشت در مشترکات جنگلی: هم افزایی، مبادله، و پیامدهای REDD+. محیط زیست Res. Lett. 11 , 44017 (2016).
-
Onaindia، M.، Fernández de Manuel، B.، Madariaga، I. & Rodríguez-Loinaz، G. مزایا و معاوضه بین تنوع زیستی، ذخیره کربن و تنظیم جریان آب. برای. Ecol. مدیریت کنید. 289 ، 1-9 (2013).
-
نایت، ای تی و همکاران. دانستن اما انجام ندادن: انتخاب مناطق حفاظتی اولویت دار و شکاف تحقیق و اجرا. حفظ کنید. Biol. 22 ، 610-617 (2008).
-
برانسون، ام. تعریفی از «قابلیت اجتماعی» در مدیریت اکوسیستم، گزارش فنی عمومی خدمات جنگلداری وزارت کشاورزی ایالات متحده . (1996).
-
Bennett, NJ استفاده از ادراکات به عنوان شواهدی برای بهبود حفاظت و مدیریت زیست محیطی. حفظ کنید. Biol. 30 ، 582-592 (2016).
-
ریشتر، آی و همکاران. ایجاد پل بین رشته های علوم طبیعی و اجتماعی: یک روش استاندارد برای ترکیب داده ها در مورد روندهای کیفیت اکوسیستم فیلوس ترانس. R. Soc. B Biol. علمی 377 , 20210487 (2022).
-
ریموند، سی ام و همکاران حفاظت فراگیر و چارچوب جهانی تنوع زیستی پس از 2020: تنش ها و چشم اندازها. One Earth 5 , 252-264 (2022).
-
Estévez، RA، Anderson، CB، Pizarro، JC & Burgman، MA شفاف سازی ارزش ها، ادراکات خطر، و نگرش ها برای حل یا اجتناب از درگیری های اجتماعی در مدیریت گونه های مهاجم. حفظ کنید. Biol. 29 ، 19-30 (2015).
-
براون، جی و همکاران. ادغام داده های فضایی اجتماعی برای ارزیابی فرصت ها و اولویت های حفاظتی Biol. حفظ کنید. 236 ، 452-463 (2019).
-
Verheij, J. & Corrêa Nunes, M. عدالت و روابط قدرت در سبزسازی شهری: آیا استراتژی های سبزسازی شهری لیسبون می تواند به عدالت زیست محیطی بیشتری منجر شود؟ محیط محلی 26 ، 329-346 (2021).
-
ترمانسن، ام. و همکاران. فصل سوم: پتانسیل ارزش گذاری. در گزارش ارزیابی روششناختی ارزشهای متنوع و ارزشگذاری ماهیت پلتفرم علمی-سیاست بین دولتی در زمینه تنوع زیستی و خدمات اکوسیستمی . (Balvanera, P., Pascual, U., Christie, M. & Baptiste, B. eds.) (دبیرخانه IPBES، 2022). https://www.ipbes.net/the-values-assessment .
-
براون، جی، رید، پی و ریموند، CM نقشهبرداری ارزشهای مکانی: 10 درس از دو دهه تحقیق تجربی GIS مشارکت عمومی. Appl. Geogr. 116 ، 102156 (2020).
-
Raymond, CM, Kenter, J., Turner, N. & Alexander, K. مقایسه پارادایم های ابزاری و مشورتی زیربنای ارزیابی ارزش های اجتماعی برای خدمات اکوسیستم فرهنگی. Ecol. اقتصاد 107 ، 145-156 (2014).
-
کریمی، ع.، براون، جی و هاکینگز، م. روش ها و رویکردهای مشارکتی برای شناسایی کانون های اجتماعی-اکولوژیکی. Appl. Geogr. 63 ، 9-20 (2015).
-
Whitehead، AL و همکاران. ادغام ارزش های زیستی و اجتماعی هنگام اولویت بندی مکان ها برای حفاظت از تنوع زیستی. حفظ کنید. بیول _ (2014). https://doi.org/10.1111/cobi.12257 .
-
کانگاس، ک. و همکاران. هم افزایی کاربری و شناسایی تضادها در چارچوب تحلیل سازگاری و ارزیابی فضایی ارزش های اکولوژیکی، اجتماعی- فرهنگی و اقتصادی. جی. محیط زیست. مدیریت کنید. 316 ، 115174 (2022).
-
Lampinen، J. و همکاران. پیشبینی زیرساختهای سبز شهری با کربن هوشمند و فقط. شهری برای. Urban Green 75 , 127682 (2022).
-
ماهیت شبکه قانون پیشنهادی احیای طبیعت اتحادیه اروپا: شهرها و مناطق چه نقشی دارند؟ خلاصه خط مشی https://networknature.eu/sites/default/files/uploads/networknature-policy-brief-v03.pdf (2022).
-
اگرمونت، اچ و همکاران. راه حل های مبتنی بر طبیعت: تأثیر جدید برای مدیریت و تحقیقات محیطی در اروپا. GAIA – Ecol. چشم انداز علمی سوسیال _ 24 ، (2015). https://doi.org/10.14512/gaia.24.4.9 .
-
ارشاد سرابی، S.، هان، QL، Romme، AG، de Vries، B. & Wendling، L. عوامل کلیدی و موانع جذب و پیادهسازی راهحلهای مبتنی بر طبیعت در محیطهای شهری: مروری. منابع 8 در (2019). https://doi.org/10.3390/resources8030121 .
-
شهر هلسینکی درباره شهر https://welcome.helsinki/about-the-city-of-helsinki/#5f9de557 (2022).
-
منطقه اقتصادی اروپا چه کسانی از طبیعت در شهرها سود می برند؟ نابرابری های اجتماعی در دسترسی به فضاهای سبز و آبی شهری در سراسر اروپا (2022).
-
شهر هلسینکی شهر هلسینکی برنامه اقدام تنوع زیستی 2021-2028 . https://www.hel.fi/static/liitteet/kaupunkiymparisto/julkaisut/julkaisut/HNH-2035/Carbon_neutral_Helsinki_Action_Plan_1503019_EN.pdf (2021).
-
شهر هلسینکی برنامه اقدام هلسینکی 2035 کربن خنثی . https://www.hel.fi/static/liitteet/kaupunkiymparisto/julkaisut/julkaisut/HNH-2035/Carbon_neutral_Helsinki_Action_Plan_1503019_EN.pdf (2018).
-
Hautamäki, R. فضای سبز رقابتی و ساخته شده در شهر فشرده: مطالعه موردی طرح شهر هلسینکی 2016. J. Landsc. آرشیت. 14 ، 20-29 (2019).
-
Hannikainen، MO برنامه ریزی یک شهر سبز: مورد هلسینکی، 2002–2018 BT – برنامه ریزی شهرهای با طبیعت: نظریه ها، استراتژی ها و روش ها. در (ویرایشهای Lemes de Oliveira, F. & Mell, I.) 121–134 (Springer International Publishing, 2019). https://doi.org/10.1007/978-3-030-01866-5_9 .
-
شهر هلسینکی مدیریت جنگل ها . https://www.hel.fi/helsinki/fi/asuminen-ja-ymparisto/luonto-ja-viheralueet/hoito/metsien/ (2022).
-
فاگرهولم، ن. و همکاران. تجزیه و تحلیل تفریحات همه گیر در فضای باز و زیرساخت های سبز در شهرهای شمال اروپا برای افزایش تاب آوری شهری npj Urban Sustain 2 , 25 (2022).
-
ویریککو جی; نیملا، ج. جالکانن، ج. Tamminen, N, KS Helsingin kestävä viherrakenne: Miten turvata kestävä viherrakenne ja kaupunkiluonnon monimuotoisuus tiivistyvässä kaupunkirakenteessa – kaupunkiekologinen tutkimusraportti. OP- در http://hdl.handle.net/10138/153476 (2014).
-
Folkard-Tapp, H., Banks-Leite, C. & Cavan, EL راه حل های مبتنی بر طبیعت برای مقابله با تغییرات آب و هوا و بازیابی تنوع زیستی. J. Appl. Ecol. 58 ، 2344-2348 (2021).
-
پتورلی، ن. و همکاران. زمان ادغام برنامههای سیاست علمی تغییر آب و هوا و تنوع زیستی جهانی است. J. Appl. Ecol. 58 ، 2384-2393 (2021).
-
Pressey، RL & Bottrill، MC اپورتونیسم، تهدیدها، و تکامل برنامه ریزی سیستماتیک حفاظت. حفظ کنید. Biol. 22 ، 1340-1345 (2008).
-
پیندا-پینتو، ام. و همکاران. برنامه ریزی شهرهای عادلانه زیست محیطی: چارچوبی برای ارزیابی نقاط داغ بی عدالتی اکولوژیکی برای طراحی شهری هدفمند و برنامه ریزی راه حل های مبتنی بر طبیعت. تصمیم سیاست شهری 40 ، 206-222 (2022).
-
Korpilo، S.، Kaaronen، RO، Olafsson، AS و Raymond، CM مشارکت عمومی GIS می تواند به ارزیابی ابعاد چندگانه عدالت زیست محیطی در برنامه ریزی فضای سبز و آبی شهری کمک کند. Appl. Geogr. 148 ، 102794 (2022).
-
Raymond, CM, Gottwald, S., Kuoppa, J. & Kyttä, M. ادغام چندین عنصر عدالت زیست محیطی در برنامه ریزی فضای آبی شهری با استفاده از سیستم های اطلاعات جغرافیایی مشارکت عمومی. Landsc. طرح شهری. 153 ، 198-208 (2016).
-
براون، جی و همکاران. تأثیر طراحی نمونه بر کیفیت داده های مکانی در یک پروژه علمی شهروندی جغرافیایی. ترانس. GIS. 23 ، 1184-1203 (2019).
-
Grabowski، ZJ، McPhearson، T. & Pickett، STA تغییر برنامه ریزی زیرساخت سبز شهری ایالات متحده برای رسیدگی به عدالت. Landsc. طرح شهری. 229 ، 104591 (2023).
-
شهر هلسینکی سالنامه آماری هلسینکی . https://www.hel.fi/uutiset/en/kaupunginkanslia/statistical-yearbook-of-helsinki-2021-has-been-published (2021).
-
Järvi, L., Grimmond, CSB & Christen, A. طرح تعادل انرژی و آب شهری سطحی (SUEWS): ارزیابی در لس آنجلس و ونکوور. جی هیدرول. 411 ، 219-237 (2011).
-
Ward, HC, Kotthaus, S., Järvi, L. & Grimmond, CSB Surface Urban Energy and Water Scheme (SUEWS): توسعه و ارزیابی در دو سایت بریتانیا. اقلیم شهری. 18 ، 1-32 (2016).
-
Strömberg, J. StromJan/Raster4H: نسخه نهایی (نسخه v1.1). در (2020).
-
اوربانسکی، اس و همکاران. عوامل کنترل کننده تبادل CO 2 در مقیاس های زمانی از ساعتی تا دهه ای در جنگل هاروارد. جی. ژئوفیس. Res . 112 ، (2007). https://doi.org/10.1029/2006jg000293 .
-
Järvi، L. و همکاران. ایستگاه اندازهگیری شهری SMEAR III: پایش مداوم آلودگی هوا و تعاملات سطح و جو در هلسینکی، فنلاند. محیط شمالی. Res. 14 ، 86-109 (2009).
-
Havu, M., Lee, HS, Soininen, J. & Järvi, L. تنوع فضایی شار CO2 بیوژنیک در هلسینکی در سال 2020 (نسخه 1) . https://zenodo.org/record/7198140#.Y9tQFnZBw2w (2020).
-
مونوز ساباتر، J. ERA5-داده های ساعتی زمین از سال 1981 تا کنون . فروشگاه داده های آب و هوا (CDS) خدمات تغییر آب و هوا کوپرنیک (C3S). https://doi.org/10.24381/cds.e2161bac (2019).
-
بررسیهای Dillman، DA، Smyth، JD & Christian، LM ، اینترنت، تلفن، پست و حالت ترکیبی: روش طراحی متناسب، ویرایش چهارم . (جان وایلی و پسران، 2014).
-
Lechner, AM, Stein, A., Jones, SD & Ferwerda, JG سنجش از دور ویژگیهای کوچک و خطی: تعیین کمیت اثرات اندازه و طول پچ، موقعیت شبکه و قابلیت تشخیص بر روی نقشهبرداری پوشش زمین. سنسور از راه دور محیط. 113 ، 2194-2204 (2009).
-
Lehtomäki، J. & Moilanen، A. روش ها و گردش کار برای اولویت بندی حفاظت فضایی با استفاده از پهنه بندی. محیط زیست مدل. نرم افزار 47 ، 128-137 (2013).
-
آژانس، EE Urban Atlas LCLU 2018 . https://land.copernicus.eu/local/urban-atlas/urban-atlas-2018 (2021).
-
آمار رسمی فنلاند (OSF). ساختار درآمد [نشر الکترونیکی]. ISSN=1799-0092. هلسینکی: آمار فنلاند [مراجعه شده: 2022/8/29]. http://www.stat.fi/til/pra/index_en.html (2022).
Leave A Comment